How to Uncover Financial Fraud in Stocks: An Investor’s Guide

Financial fraud in the stock market can have devastating effects on investors. Recognizing the early warning signs is crucial. This article explores how discrepancies between net income and free cash flow might signal fraud, the importance of identifying off-balance-sheet items, and practical strategies for safeguarding your portfolio. We'll also examine the recent scrutiny of Super Micro Computer (NASDAQ:SMCI) by Hindenburg Research, using it as a case study to highlight some of these risks in real-world scenarios.
Net Income vs. Free Cash Flow Discrepancies
One of the most critical indicators of financial manipulation is a significant discrepancy between net income and free cash flow (FCF). Net income is the profit a company reports after all expenses, while FCF represents the actual cash generated after capital expenditures. While short-term differences can occur due to the timing of cash flows, a consistent pattern of high net income and low or negative FCF could suggest that the company is manipulating its earnings.
Why It Matters
Earnings Manipulation: Companies might inflate net income by recognizing revenue prematurely (a common tactic) or deferring expenses, making their financial health appear better than it actually is.
Free Cash Flow as a Reality Check: FCF is harder to manipulate because it reflects actual cash flow. A large gap between net income and FCF could signal aggressive accounting practices or, worse, fraudulent activities.
Case Study: SMCI and Hindenburg Research. Is SMCI Fraudulent?
Hindenburg Research recently scrutinized Super Micro Computer, Inc. (SMCI), alleging significant issues in the company's financial practices. Hindenburg’s report highlighted concerns about discrepancies in SMCI's financials, particularly regarding revenue recognition practices, undisclosed related party transactions, and potential sanctions violations. The investigation included interviews with former employees and an analysis of company records, suggesting that SMCI might be engaging in improper revenue recognition and other questionable accounting practices.
Hindenburg's report has had a notable impact on SMCI's stock, causing a significant drop in its value. However, some analysts, such as those from JP Morgan, have expressed skepticism about the depth and substantiation of Hindenburg's claims, suggesting that the evidence presented might not be sufficient to prove wrongdoing.
Nonetheless, SMCI does display the troubling FCF vs. net income discrepancy that we warned about above, so it’s a company worth looking into for potential fraud. Below, you can see its historical net income.
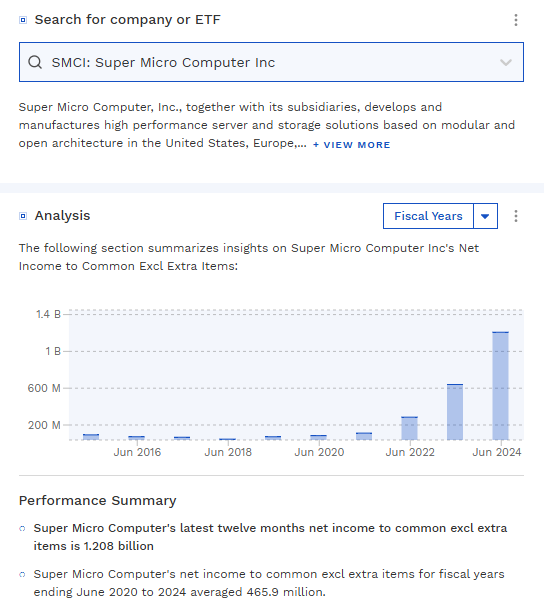
Now, compare that to its actual free cash flow, and you’ll see a stark difference.

The same applies to its cash from operations. It looks quite similar to its free cash flow.
Identifying Off-Balance-Sheet Items
Off-balance-sheet items are obligations or assets that a company does not include on its balance sheet, making it difficult for investors to get a complete picture of the company’s financial health. These items can include operating leases, special purpose vehicles (SPVs), or complex financial arrangements.
How to Find Off-Balance-Sheet Items
Read the Footnotes: Financial statements often contain footnotes where companies disclose off-balance-sheet items. These footnotes may include information about leases, debt obligations, and other financial arrangements not reflected on the main balance sheet.
Look for Operating Leases: Some companies classify long-term leases as operating leases instead of capital leases, keeping them off the balance sheet. Check the notes to the financial statements for lease commitments that don’t appear as liabilities on the balance sheet.
Examine the Cash Flow Statement: The cash flow statement can provide clues about off-balance-sheet items. For example, large discrepancies between operating cash flow and net income might indicate the presence of off-balance-sheet liabilities.
Analyze Debt and Contingent Liabilities: Some companies use SPVs to keep debt off their balance sheet. Investigate any mentions of SPVs, guarantees, or other contingent liabilities in the financial notes.
Check for Unconsolidated Entities: Some companies may have investments in entities that they don’t consolidate into their financial statements, keeping liabilities off the balance sheet. Footnotes often provide information on these unconsolidated entities.
Tools to Help Quantify Financial Manipulation in Stocks
There are a few financial models that offer insight into potential manipulation. Three well-known ones are the Beneish M-Score, the Altman Z-Score, and the Sloan Ratio. Let’s dive right in:
The Beneish M-Score: Detecting Earnings Manipulation
The Beneish M-Score is a mathematical model developed by Professor Messod Beneish that uses eight financial ratios to detect whether a company has manipulated its earnings. The M-Score is calculated based on variables such as days’ sales in receivables, gross margin, and asset quality. A higher M-Score (typically above -1.78) suggests a higher likelihood of earnings manipulation. Investors can use the M-Score as an early warning system to identify companies that may be engaging in fraudulent financial practices.
The Altman Z-Score: Assessing Bankruptcy Risk
The Altman Z-Score is a financial model developed by Edward Altman that predicts the likelihood of a company going bankrupt within the next two years. It uses five financial ratios, including working capital to total assets and retained earnings to total assets, to calculate a score. A Z-Score above 3.0 indicates a low risk of bankruptcy, while a score below 1.8 suggests a high risk. Investors can use the Altman Z-Score to assess the financial health and solvency of a company.
The Sloan Ratio: Identifying Accruals Manipulation
The Sloan Ratio, named after Professor Richard Sloan, measures the proportion of a company’s earnings that come from non-cash accruals. A high Sloan Ratio suggests that a significant portion of earnings comes from accruals rather than actual cash flows, which can be a red flag for earnings manipulation. Investors should be cautious of companies with a high Sloan Ratio, as it indicates that the reported earnings may not be sustainable over time.
How to Protect Yourself as an Investor
While uncovering financial fraud is challenging, taking the following steps can help protect your investments:
Perform a Cash Flow Analysis: Don’t just rely on net income. Analyze the company’s cash flow statements to see if the cash generated by the business aligns with its reported earnings. Consistent discrepancies should raise red flags.
Investigate Accounting Practices: Pay close attention to changes in a company’s accounting policies. Frequent changes, especially those that favorably impact earnings, may indicate that management is trying to manipulate financial results.
Use Forensic Accounting Tools: Tools like the Beneish M-Score, Altman Z-Score, and Sloan Ratio mentioned above can help identify companies with a high probability of earnings manipulation. These models use various financial ratios to detect potential red flags.
Look Beyond the Numbers: Consider qualitative factors such as management’s reputation, the complexity of the business model, and the company’s history of regulatory compliance. A management team with a history of aggressive accounting practices should be a red flag.
Stay Informed About Short-Seller Reports: Short-seller reports, like those from Hindenburg Research, often provide in-depth analysis and identify potential red flags that other analysts might miss. While these reports can be controversial, they offer valuable insights into companies that might be engaging in dubious practices.
Conclusion
Spotting financial fraud takes a sharp eye, a skeptical mindset, and a willingness to dig deep into a company’s financials. When you see things like a big gap between net income and free cash flow, off-balance-sheet items, or odd accounting practices, it could be a sign that something’s off. The recent scrutiny of SMCI by Hindenburg Research shows that even seemingly solid companies might potentially have hidden issues. Doing thorough due diligence and using forensic accounting tools can help investors protect themselves from these risks.
Thanks for reading. If you’re looking for a trustworthy site for fundamental analysis, consider using Finbox. Finbox provides access to essential fundamental data, along with advanced stock screeners, investment ideas, valuations, and much more.