Super Micro Computer Stock (NASDAQ:SMCI): The Financials Ring Alarm Bells

Super Micro Computer (SMCI) stock has been in the spotlight in the past week. Shares of the high-performance server and storage solutions provider have fallen because of a short-seller report from Hindenburg Research and news that SMCI won't be filing its annual report on time. The short-seller report essentially accused SMCI of financial manipulation, which isn’t impossible, as we see a few key signs ourselves, and the late filing news combines to paint an ugly picture and ring alarm bells.
However, some may be wondering whether the stock is a buy now that it's down substantially from its all-time high. While the stock is certainly less risky than it was a few months ago, when it was trading at over $1,200, it's still not too attractive, in our view. That's because the financials are not as great as they seem, especially because of the lack of free cash flow. Plus, there are key financial manipulation risks to consider, and some of the company's operating metrics (such as its gross profit margin) are weak when compared to competitors.
As a result, we have a Hold rating on the stock.
What Does Super Micro Computer Do?
We feel the need to explain what SMCI actually does because we wouldn't be surprised if many investors have bought into the stock based on AI hype without even knowing exactly what they're investing in. But let's keep it short.
Essentially, Super Micro Computer designs, manufactures, and sells high-performance server and storage solutions. SMCI offers customized, scalable products/solutions that are vital for data centers, cloud computing, AI, and enterprise IT.
Is SMCI Similar To Nvidia (NVDA)?
Not quite. While Nvidia focuses on GPUs (graphics processing units) and AI platforms, SMCI provides the hardware infrastructure that supports these technologies, including servers and storage systems that integrate with Nvidia’s GPUs.
In simpler terms, if Nvidia makes the "brains" for AI, SMCI makes the "body" that supports and runs those brains. Now, let's get to the meat of the article.
The Main Red Flag For SMCI -- No Free Cash Flow
It was amazing to see SMCI stock race to new highs every day earlier this year, but we always thought to ourselves, "Where's the free cash flow?" We like to look at free cash flow (or at least cash from operations) because it actually shows the company's ability to generate cash. Meanwhile, net income can often be overstated via accounting tricks, and it seems like Super Micro Computer could be doing that.
As you can see in the image below, Super Micro Computer's trailing-12-months cash flow from operations comes out to -$2.479 billion. When I manually calculated its trailing capital expenditures of $137.3 million (by taking its $27 million of CapEx reported in Q4 and adding it to the $110.3 million reported in the nine-month period before that), we got a free cash flow figure of about -$2.62 billion.

SMCI TTM Cash Flow -- Source (Seeking Alpha)
Meanwhile, if you were to look at its income statement for the trailing 12 months, you'd see a positive net income of $1.21 billion. That's quite a significant difference.
This trend goes back several years. Looking back to Fiscal 2015, we can see below that SMCI has only had positive cash flow in five of the last 10 fiscal years.
Its total free cash flow from Fiscal 2015 to Fiscal 2024 comes in at approximately -$2.321 billion. SMCI's cash flow from operations is also negative during this period, as its capital expenditures aren't that high to begin with.

SMCI free cash flow history (Seeking Alpha)
However, its net income was always positive, as you can see below. If you add up all the net income figures in the past 10 years, you'd get a positive net income of about $2.679.2 billion.
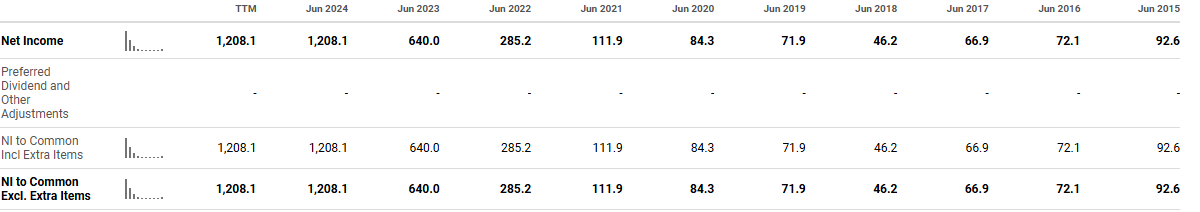
SMCI's Net Income History (Seeking Alpha)
This stark differences raises suspicions. It's possible that SMCI is aggressively recognizing revenue (a common tactic in financial manipulation), and the recent Hindenburg Research report also mentioned its history of improper revenue recognition. There's also room for financial manipulation due to the related-party transactions SMCI is involved with, as it does business with Ablecom and Compuware, which are controlled by the CEO's brothers.
Nonetheless, in an effort to not make this article a reiteration of the Hindenburg report, we will also present two other metrics that suggest financial manipulation.
The Beneish M-Score Signals Potential Financial Manipulation
For those of you who don't know, the Beneish M-Score is a model that uses eight financial ratios in order to spot if a company is cooking the books. The eight ratios used are the following: Days Sales in Receivables Index, Gross Margin Index, Asset Quality Index, Sales Growth Index, Depreciation Index, Sales General and Administrative Expenses Index, Leverage Index, and Total Accruals to Total Assets.
To keep things simple, a score of above -1.78 (according to Finbox) suggests that a company is a likely financial manipulator. Now, let's see how SMCI ranks here. In the image below, I've highlighted four years where its M-Score has surpassed -1.78. What's notable is also how much the number has trended higher in the past year, now at 0.49.

The Sloan Ratio Also Suggests Manipulation
The Sloan Ratio measures how much of a company's earnings comes from non-cash accruals. If the Sloan Ratio is high, it suggests that a high amount of earnings come from accruals instead of cash flows. As per Finbox, "A Sloan Ratio between -10% and 10% is generally considered safe. If the Sloan ratio exceeds 25% or is less than -25% for consecutive years may be cause for concern."
So, here's the kicker. SMCI's Sloan Ratio is 57.1% -- well above the safe range (and much higher than usual), although it's worth noting that the range has sometimes been in the safe zone. The trend of SMCI's Sloan Ratio is something worth monitoring in the future.

And here's how it was calculated.

Sloan Ratio Calculation For SMCI (Finbox)
Now that we've addressed the potential manipulation concerns, let's move on to a peer analysis.
But first, click on that button below to help support us!
How Does Super Micro's Profitability Compare To Its Peers?
Another thing that gives us pause when looking at SMCI stock is its lower gross profit and free cash flow profitability compared to its main peers. For the peer comparison, we used Dell (DELL), Hewlett Packard (HPE), and Lenovo Group (LNVGF). Let's get right to it.
Gross Profit Margin Comparison
Below, you can see that SMCI's gross margin for the trailing 12 months is 14.1%. Over the years, this figure has seen some volatility, but it generally returns to the mean. One issue is that in the most recent quarter, its gross profit margin was 11.2% -- the lowest ever in the past 10 years, so things aren't looking too great.
On the other hand, its competitors all have higher gross profit margins that have been trending higher in recent years, signaling steady and strong businesses.

Data by YCharts
Cash Return on Capital Invested (CROCI) Comparison
Next, SMCI's competitors all have positive cash return on capital invested metrics. That's because they generate free cash flow. Meanwhile, SMCI's CROCI is negative, of course.

Data by YCharts
While it’s important to note that Super Micro Computer is growing its revenue at a much faster clip than these companies, the risks mentioned above make investing in the stock too risky, in our view.
Is Super Micro Computer Stock Undervalued or Overvalued?
There are two main sides to this argument. First, people can look at SMCI's earnings per share and forward P/E projections and come to the conclusion that the stock is undervalued. That's because the stock is trading at a forward P/E of around 13x for June 2025 and 10x for June 2026. Plus, its forward PEG ratio comes in at 0.3x, indicating extreme undervaluation. However, the question is, can these earnings projections be trusted, and will these earnings translate to cash flow? If SMCI continues to lack in the free cash flow department, then the stock is overvalued, in our view.

SMCI EPS Estimates (Seeking Alpha)
We generally value stocks using a free reverse DCF calculator that we created. Essentially, it calculates an implied growth rate that the market is expecting, and then we decide if the stock can exceed that implied growth rate (which would make it undervalued) or not (which would make it overvalued). A more comprehensive guide can be found here.
For SMCI, again, it's tricky because the FCF is negative, so we wouldn't even consider buying it. However, you can still input EPS into the calculation where it says "Free Cash Flow per Share ($)." It will just be a valuation based on EPS instead. When doing this, using a cost of equity of 9.1% (taken from Finbox) and a terminal growth rate of 3% per year, we can see that the market is currently pricing SMCI as if it will grow its EPS by 5.523% per year for the next 10 years and then 3% per year after that in perpetuity.

Of course, this may seem extremely undervalued to the bulls. However, it just goes to show the level of skepticism involved with the stock's ability to generate true earnings.
The Takeaway
While we are not outright accusing Super Micro Computer of financial manipulation, there are some signs worth noting that can make it more likely than average. These signs include a stark difference in free cash flow and net income, a high Beneish M-Score, and a high Sloan Ratio. On top of this, the stock's profitability metrics are not as high (and aren't trending as positively) as those of its peers, which makes us question if it's even the best stock in its sector.
Of course, if there is no manipulation going on and free cash flow can eventually catch up to net income, then Super Micro stock can be a super bargain. However, that's too speculative of a position for us to take. As a result, we rate the stock as a Hold.
Thanks for reading! If you liked this article, you might like the article linked in the image below.

Also, If you’re looking for a trustworthy site for fundamental analysis, consider using Finbox. Finbox provides access to essential fundamental data, along with advanced stock screeners, investment ideas, valuations, and much more.