You’re Using The RSI Indicator Backwards. Here’s The Data
When people start studying technical analysis for the first time, one of the first indicators they learn about is the Relative Strength Index (RSI). When the RSI is over 70, it signals overbought conditions for a security, and when it’s under 30, its underbought. Logically, the next conclusion they come to is that you should buy stocks that are oversold according to the RSI and then sell them when they’re overbought. You know how it is.
What if I told you that strategy doesn’t work well by default for stocks?
Actually, what if I told you the exact opposite strategy works better when trading the S&P 500 and some other tickers? It’s true. At least according to the backtests I performed, which I’ll show below.
The more you study the stock market, the more you realize that many things that intuitively make sense at first don’t actually apply cleanly when trading or investing.
This is one of those things.
My findings (and experience) show that you’ll actually get better results buying overbought stocks and selling them when they’re oversold. Not in every case, but in many cases. Let’s get into it.
Buying When The RSI Is Under 30, Selling When It’s Over 70
Let’s test whether conventional wisdom works on the overall market. Surely, if the S&P 500 is oversold, it should bounce back right? And then you just sell when it’s overbought?
Well, below are the results for using that strategy.
Conditions: Buy the SPY when RSI crosses under 30. Sell when it crosses over 70. On the daily time frame.
Now, here are the results over 33 years. This strategy returned 238% when using it on the SPY ETF. Meanwhile, the SPY returned 1470.4% over the same time frame. Even worse, the max drawdown using this strategy was 60.2%, while the max drawdown for SPY was a lower 56.7%. This strategy took 26 positions over 33 years.
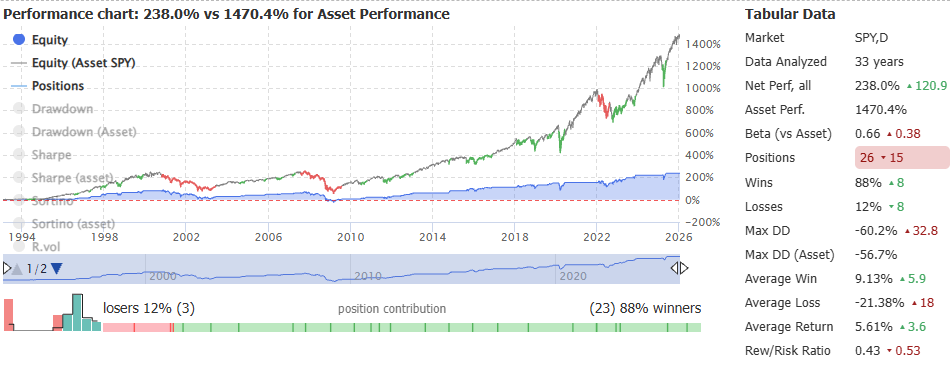
Despite the positive performance, it’s clear that the strategy just didn’t do well at all. Weaker performance against the benchmark AND a higher drawdown. It’s not just for the S&P 500 though.
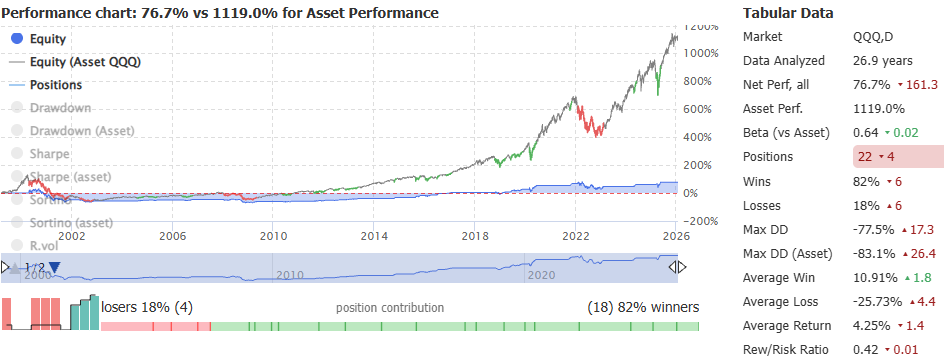
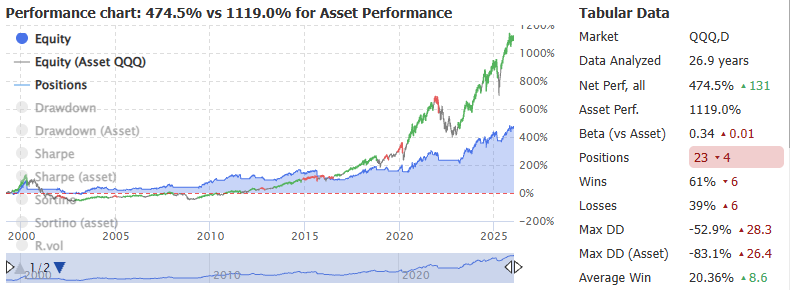
Here’s the same backtest against the Nasdaq 100 ETF (QQQ).
You would have gotten a 76.7% return in 33 years instead of 1,119%. A grandma buying bonds would have outperformed you. Max drawdown was crazy at 77.5%. Not good.
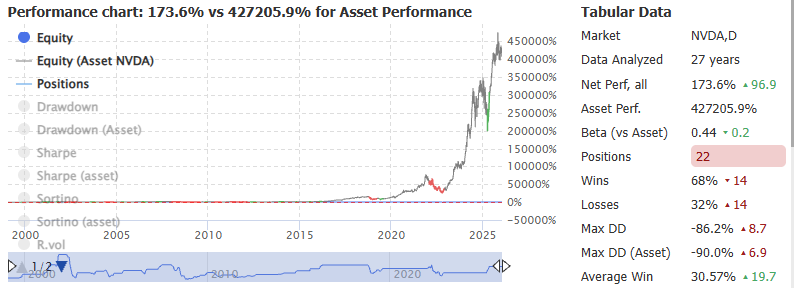
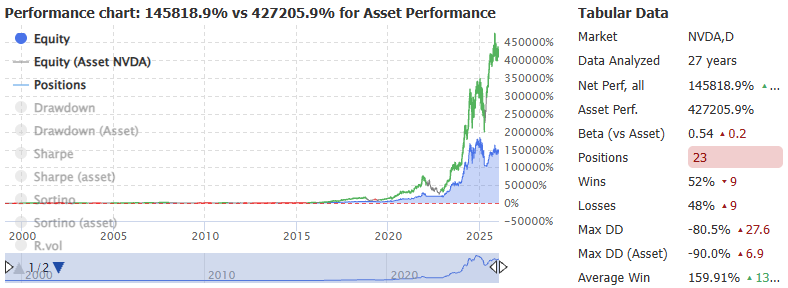
What about individual stocks? Let’s try Nvidia.
This one is even more embarrassing. Buying NVDA 27 years ago would have made you a 4,273x return, or 427,205.9%. Meanwhile, buying it when it was oversold and selling when it was overbought would have netted you just 173.6%, with almost the same max drawdown as buying and holding NVDA. 86.2% max drawdown for this strategy vs. 90% for NVDA.
Buying When The RSI Is Over 70, Selling When It’s Under 30
New conditions:
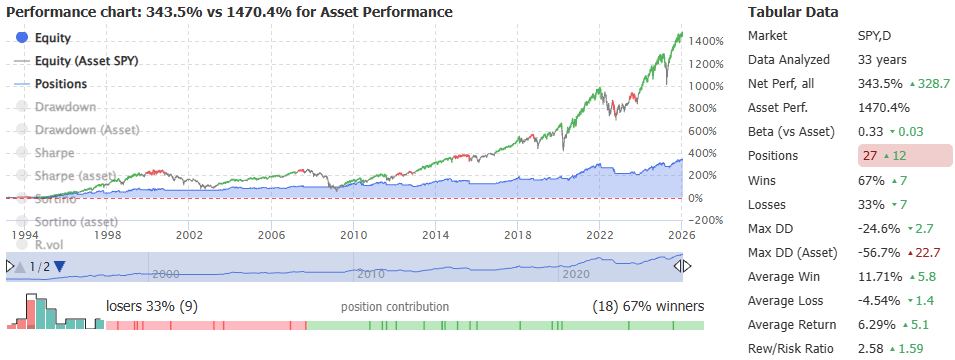
Buy SPY when RSI cross above 70. Sell when it crosses under 30. In other words, buy when it’s overbought, sell when it’s oversold.
Here were the results over 33 years. 343.5% return and max drawdown of 24.6% compared to 56.7% for the SPY. Now, this still underperformed the SPY heavily here, but that’s not the point of this article. The point is to compare it to conventional RSI usage. The first strategy returned a lower 238% with a much higher max drawdown of 60.2%.
How about on the QQQ ETF? Again, same type of results. Higher overall return and lower drawdown compared to the previous strategy.
Same thing when using NVDA as the example.
Why Does This Happen?
The reason this happens has less to do with the RSI itself and more to do with the nature of stocks. Stocks, especially indices and large-cap growth names, are not mean-reverting instruments over long periods of time. They have a built-in upward bias driven by earnings growth, inflation, buybacks, and index rebalancing.
When an index or a strong stock becomes “overbought” on the RSI, it often isn’t stretched in the way people assume. More often, it’s trending. Buying when the RSI pushes above 70 is effectively buying strength in a market that tends to reward sustained momentum rather than quick reversals.
On the flip side, oversold readings in stocks often show up during real stress events, not routine pullbacks. The RSI dipping below 30 usually coincides with macro shocks, earnings disappointments, or broader risk-off phases where prices can stay depressed much longer than expected.
Selling when the RSI moves above 70 forces you to exit strong trends early, while buying when the RSI collapses pulls you into periods where downside pressure hasn’t fully resolved.
In other words, conventional RSI usage assumes stocks behave like range-bound assets, when in reality they often behave more like trend-following instruments most of the time. The backtests reflect that mismatch.
There Are Exceptions
Now, there are exceptions. For example, trading the Dow Jones with the conventional RSI strategy actually ended up performing better than buying when it was overbought. You can see that in the charts below. The first chart is the conventional RSI strategy vs. the Dow Jones ETF (DIA) and the 2nd image is the, let’s call it, “inverted” RSI strategy.
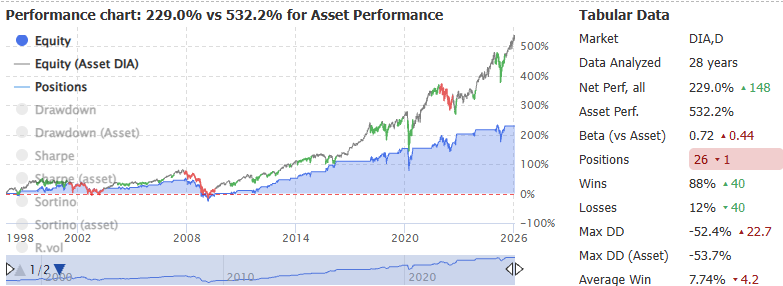
Trading DIA with the “conventional” RSI strategy
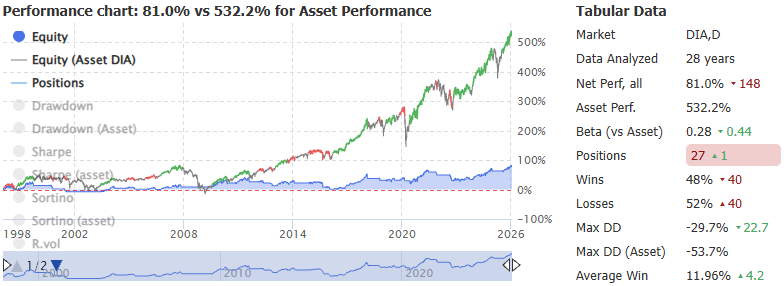
Buying the DIA When Overbought. Selling When Oversold
Even after adjusting for the max drawdown differences, I think it’s safe to say that using the conventional RSI strategy worked better on the DIA ETF.
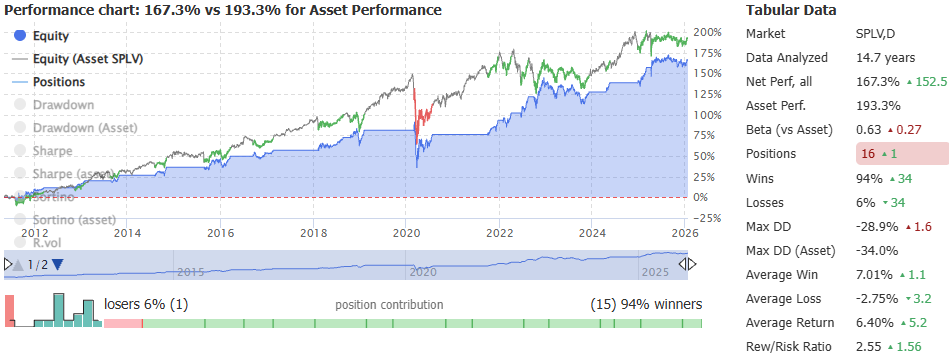
I noticed that lower volatility stocks or ETFs (the Dow included) tend to perform better with a conventional use of RSI rather than the inverted method. For example, here’s the performance of using this strategy on the SPLV ETF (S&P 500 low volatility ETF).
Again, conditions are: Buy when RSI goes under 30, sell when it goes over 70. The risk-adjusted results were actually pretty good here.
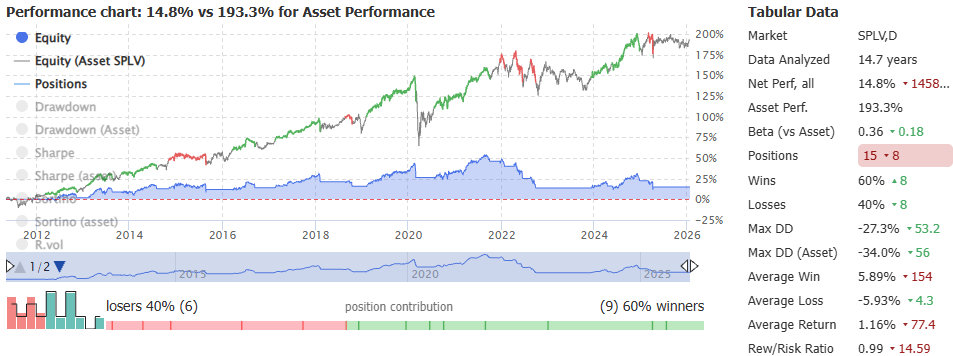
On the other hand, the inverted strategy did poorly here, returning just 14.8% over 14.7 years.
Why Do Low-Volatility Stocks Behave Differently Here?
I can’t give a certain answer, but here’s what I think. The Dow is price-weighted, heavily tilted toward mature, cash-generating companies, and historically less volatile than the Nasdaq or individual growth names. SPLV goes even further by explicitly filtering for stocks with lower realized volatility. In these markets, price tends to oscillate within tighter ranges rather than sustain long, runaway trends.
Because of that, the RSI behaves closer to how most people intuitively expect it to behave. Overbought conditions in lower-volatility baskets are more likely to mark short-term exhaustion, and oversold conditions are more likely to mean revert.
There’s simply less structural momentum pushing prices in one direction for extended periods. As a result, buying when RSI drops below 30 and selling when it rises above 70 captures those shorter, cleaner swings more effectively than chasing strength.
The takeaway isn’t that one RSI strategy is “right” and the other is “wrong.” It’s that RSI adapts to the underlying volatility and trend characteristics of the asset. High-growth, high-momentum markets tend to reward buying strength. Lower-volatility, slower-moving markets tend to reward mean reversion. The Dow and SPLV fall closer to the second category, which is why the conventional RSI approach works better there.
But Don’t Forget, These Are Just Backtests
Backtests are good, but they have their limits. It’s not the end all be all, and just because something worked in the past doesn’t mean it will work in the future. So I’m not endorsing these strategies with certainty. I’m just presenting info.
The Takeaway
There are a few takeaways here.
There’s no one-size-fits-all strategy for using the RSI. Different tickers perform in different ways. What works with one doesn’t always work with the other.
Buying the momentum (when RSI is over 70 on the daily timeframe) tends to work better for the S&P 500 and Nasdaq, so if those are the indices you try to beat, keep that in mind.
Using a conventional RSI strategy works better for low-volatility stocks.
Using just RSI by itself sucks either way and isn’t likely to get you great returns.
Where To Find The Backtesting Tool
If you want to run similar tests yourself, I used TrendSpider for the backtesting in this post. It’s a GOATed charting platform that also lets you test rule-based strategies across long timeframes without a ton of manual work. If you’re curious, you can check it out. They’re offering a 32% discount through this link. I wouldn’t mention it if it sucked.
Thanks for reading! If you liked this article and found it valuable, please consider subscribing to my Substack! It will help me out a lot. Best of luck to all of you!
This post was originally written on Substack here.